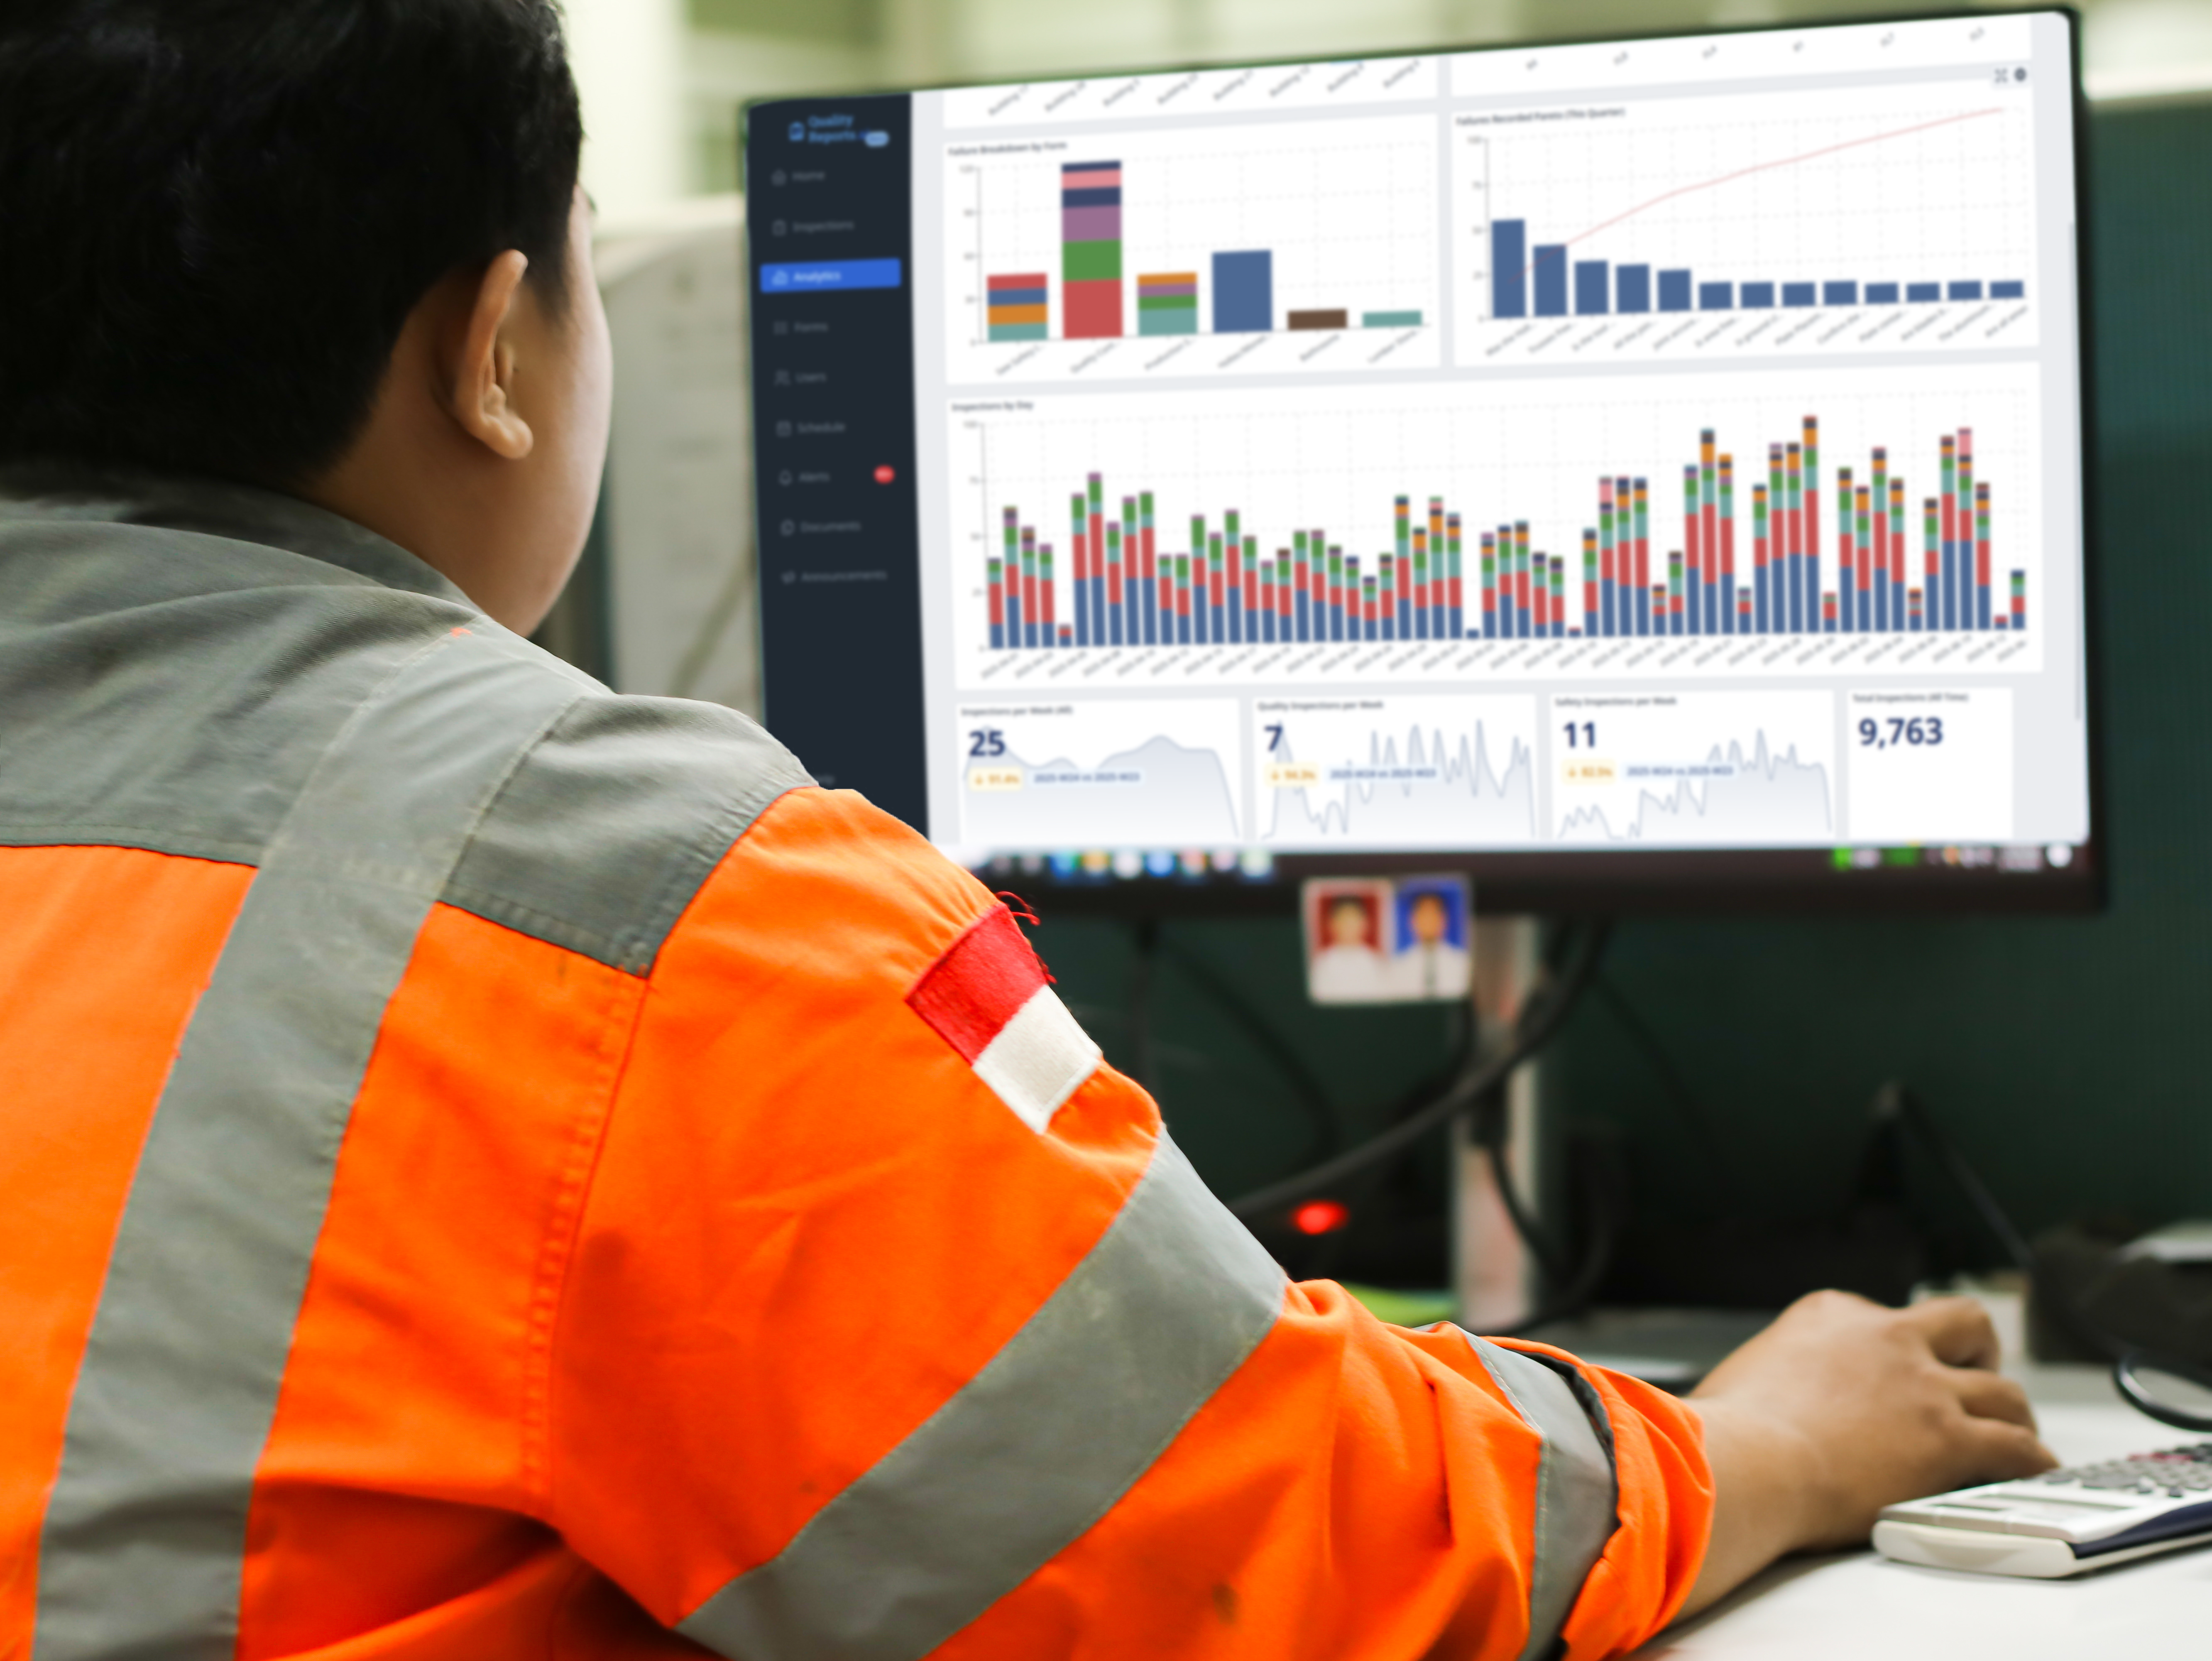
Recognize opportunities for improvement
Rather than wasting hours sifting through a stack of paper inspections, gain actionable insights to improve your operations in real time.

No more guesswork, measure workforce engagement
Effective safety and quality management systems depend on workforce engagement. Use data to track participation proactively. Ensure inspections happen consistently, meeting compliance requirements while collecting the data you need.
Participation rates
Compliance tracking
Automated reminders
Easy analysis

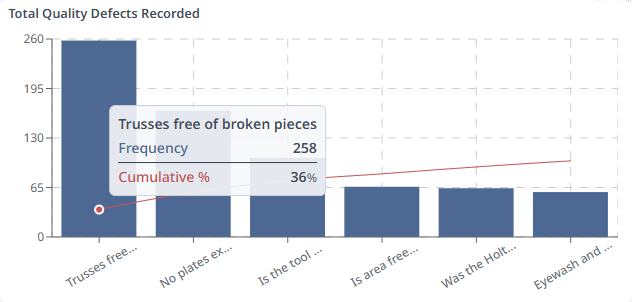
Use statistics to find areas to improve
Use quality and safety management charts such as Pareto (80/20), Control Charts, or any other common chart with your inspection data to spot problem areas and outliers with ease.
Custom dashboards
Statistical charts
Outlier detection
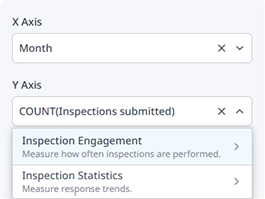
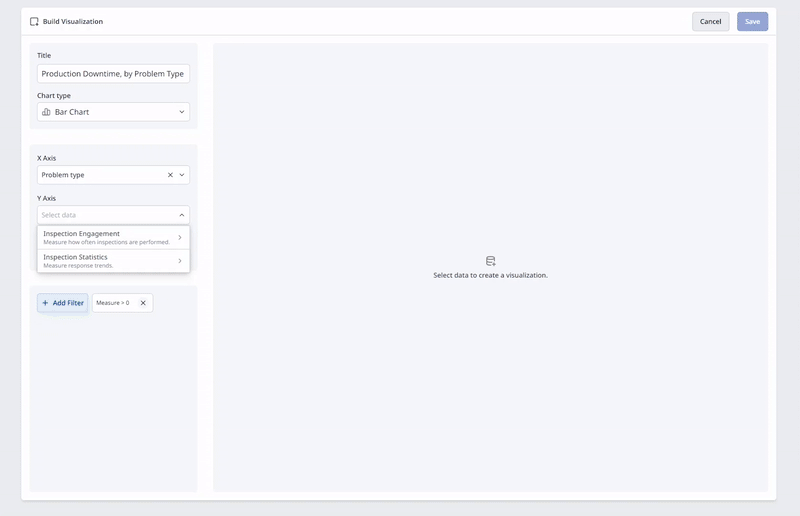
Intuitive chart builder
Gain visibility over your operations
Never lose track of your critical KPIs, whether it's defect rates, production downtime, safety incidents, or compliance status. Our system is fully customizable to your specific inspections.
Real-time KPIs
Custom dashboards
Instant alerts